When clients ask me about a quick and dirty analytics dashboard, the option that we usually end up going with is Geckoboard.
The positives of Geckoboard for a startup have to do with its quick integrations, price point, and ease of construction:
- it has dozens of built-in integrations with site analytics tools (Google Analytics, Mixpanel, Mandrill), commerce tools (Paypal, Salesforce), and social media outlets (Facebook, Twitter, Instagram)
- it's relatively cheap ($25/dashboard per month)
- you can spin up a dashboard with very basic metrics in about an hour
- no hosting required
- backend developers can easily build widgets to integrate custom data from your website by providing page callbacks with JSON or XML
- Google Sheets integration allows more complicated analytics and chart types using custom metrics when combined with the Google Analytics add-on.
This simplicity and range of pre-built integrations is somewhat of a trade-off for a presentation that is stylistically very basic and widgets that are limited in scope compared with some of the prettier options out there like Google Charts API or Dashing:
- the appearance of widgets is fairly uncustomizable (you have no control over colors, fonts, legends)
- most of the widgets only allow for one data 'series' (you can't compare multiple variables like apples and oranges over time)
- there are several kinds of charts that just aren't supported natively (area charts, stacked column and bar charts)
- if the kind of chart you're looking for doesn't exist in an integration, you're basically S.O.L.
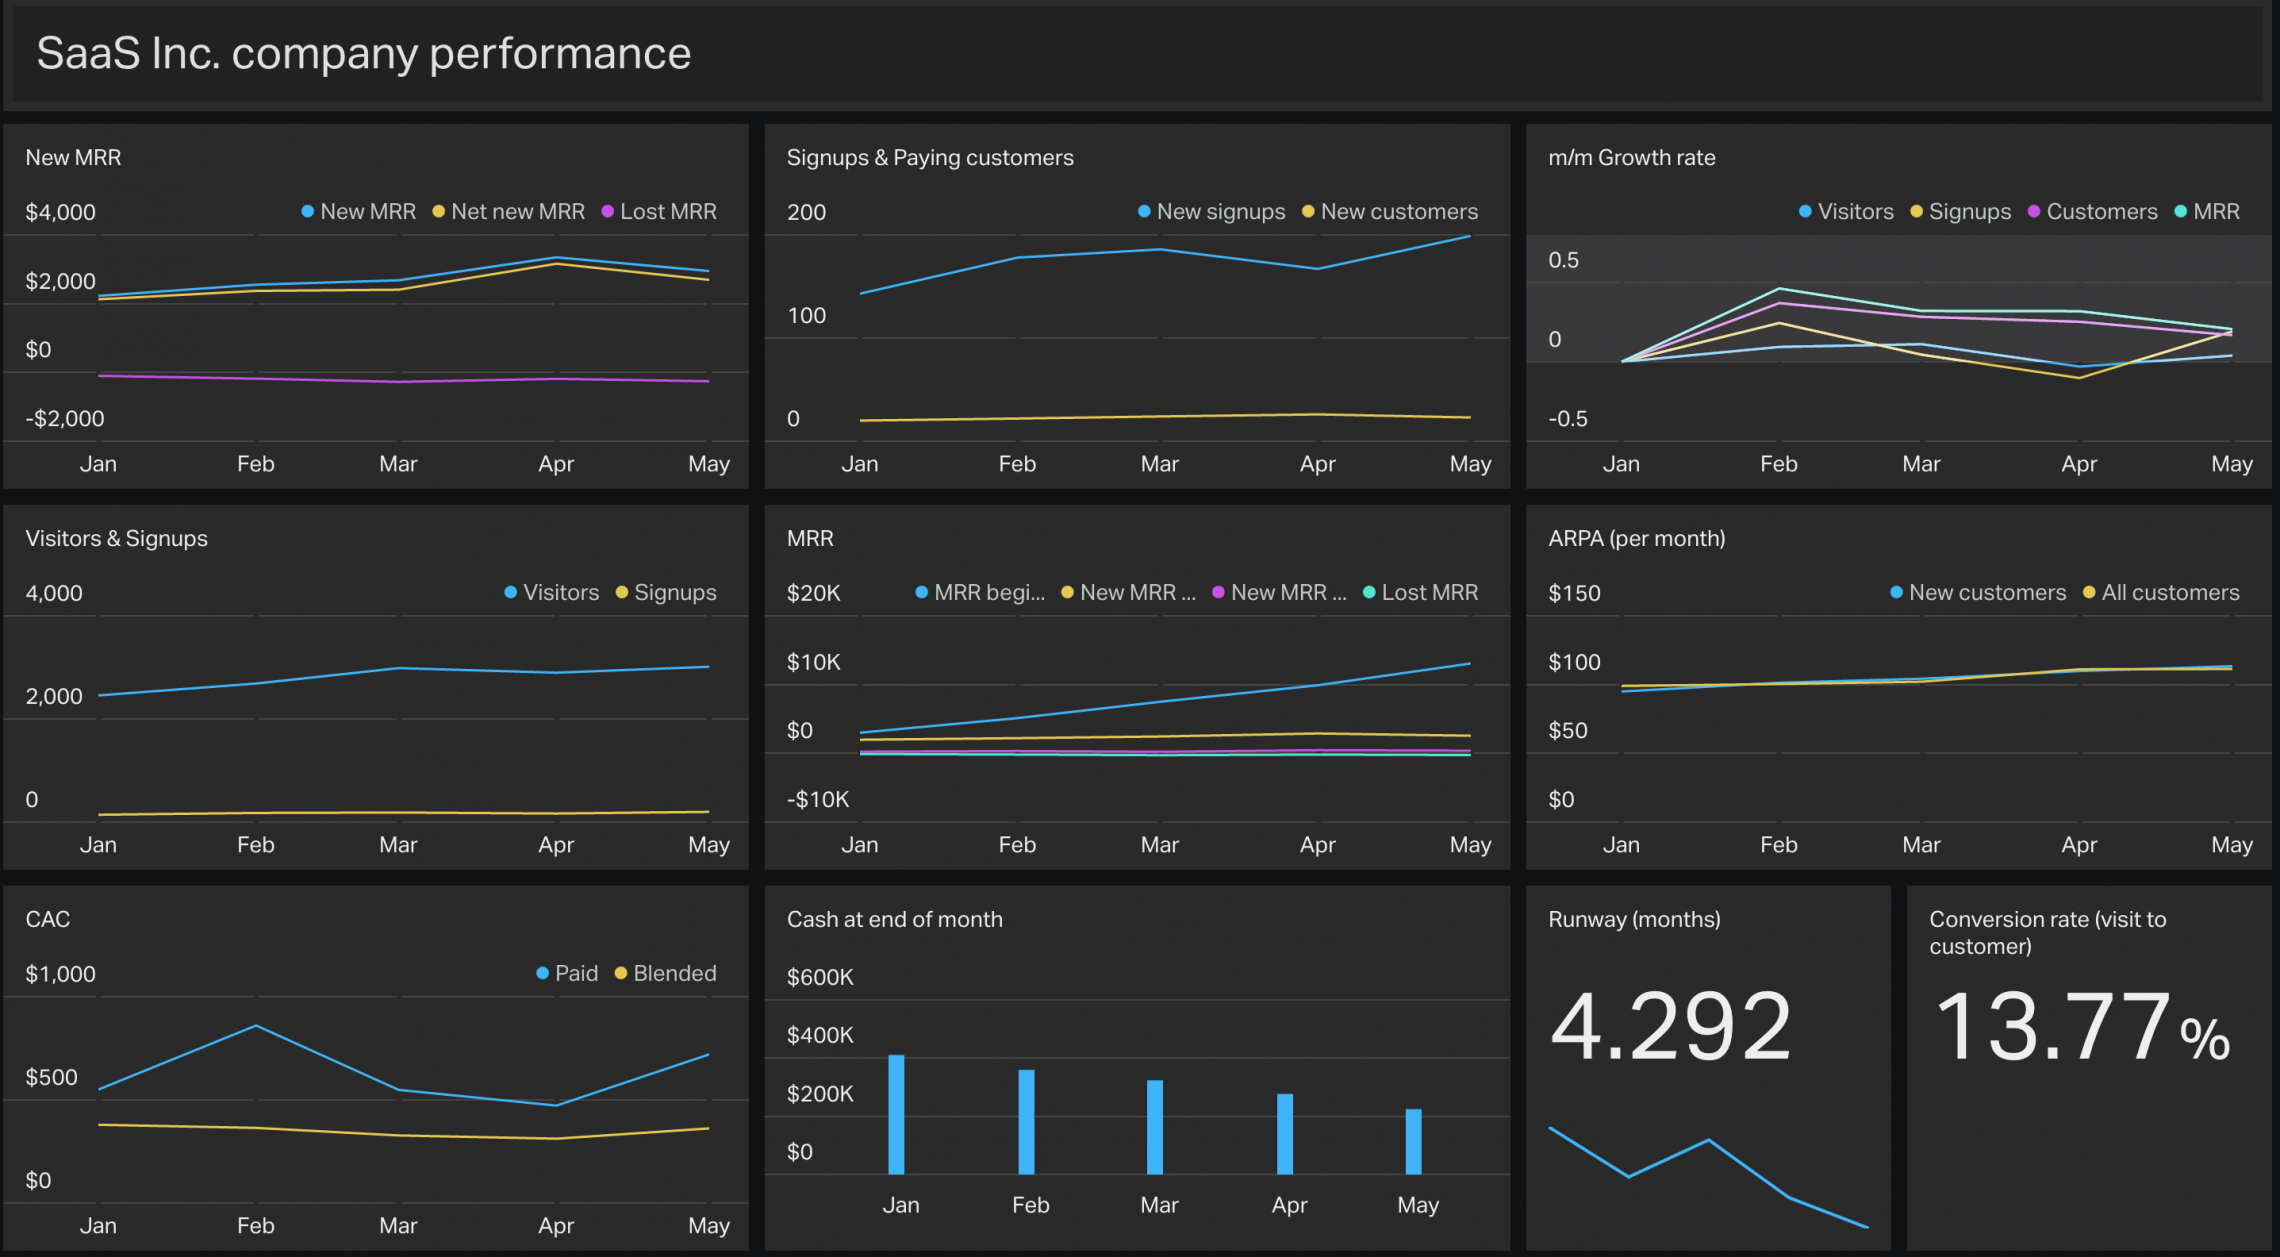
Demo Geckoboard dashboard for a SaaS company. Simple line and column charts that do a good job of representing trends in data, but are lacking complex visualization.
Fortunately, it looks like the tide is changing and Geckoboard has finally addressed all but the final complaint by providing integration with the Highcharts API.
What is the Highcharts API?
Highcharts is a highly customizable charting library written in pure JavaScript. It provides heaps of helpful and aesthetically appealing visualization options that Geckoboard's own widgets are not capable of.
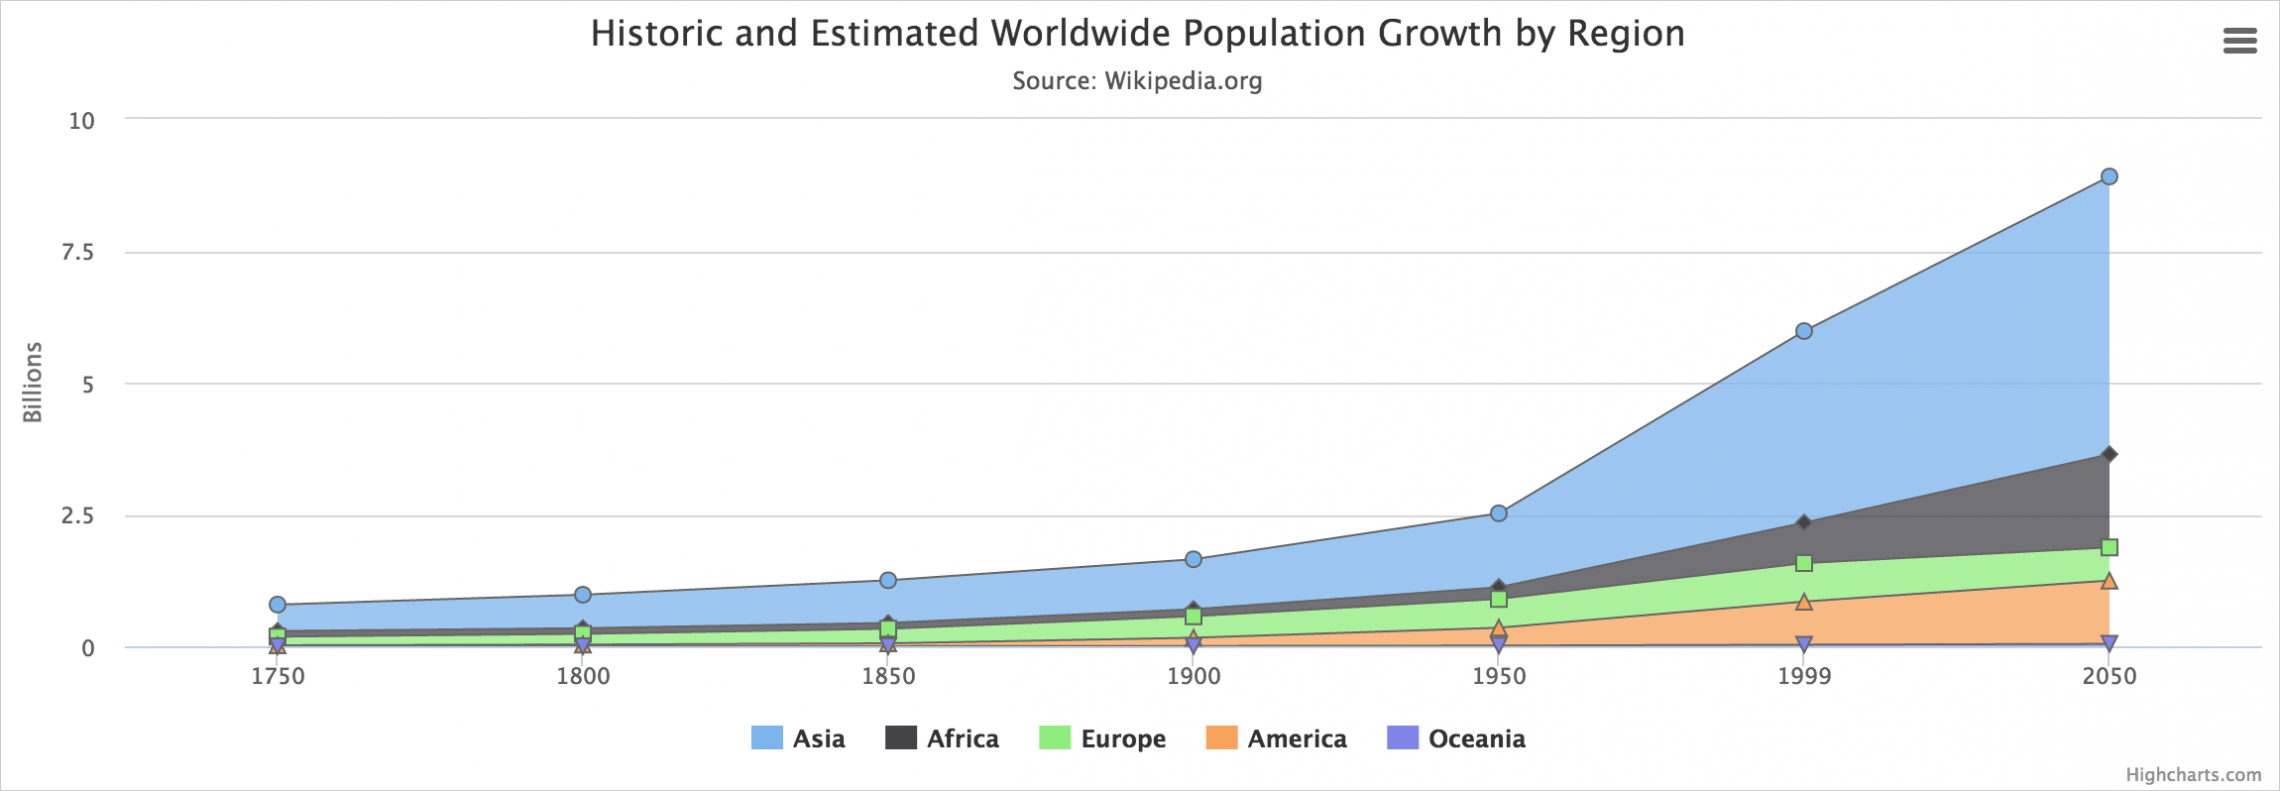
A stacked area chart is one of the supported custom chart types of Highcharts API with inspectable data points that allows Geckoboard to take a much-needed step forward in providing useful data visualizations.
For now, we should still consider Geckoboard's Highcharts widget type as in beta, as there are known limitations (some of the API options don't work as expected). The chart types that seem to work in Geckoboard are:
- Line
- Spline
- Area
- Areaspline
- Column
- Bar
- Pie
- Scatter
The markup to provide to Geckoboard is pretty simple JavaScript. You can find the various options in the Highcharts API documentation. Here's the markup for the above chart, for example:
{
  chart: {
    type: 'area'
  },
  title: {
    text: 'Historic and Estimated Worldwide Population Growth by Region'
  },
  subtitle: {
    text: 'Source: Wikipedia.org'
  },
  xAxis: {
    categories: ['1750', '1800', '1850', '1900', '1950', '1999', '2050'],
    tickmarkPlacement: 'on',
    title: {
        enabled: false
    }
  },
  yAxis: {
    title: {
      text: 'Billions'
    },
    labels: {
      formatter: function () {
        return this.value / 1000;
      }
    }
  },
  tooltip: {
    shared: true,
    valueSuffix: ' millions'
  },
  plotOptions: {
    area: {
      stacking: 'normal',
      lineColor: '#666666',
      lineWidth: 1,
      marker: {
        lineWidth: 1,
        lineColor: '#666666'
      }
    }
  },
  series: [{
    name: 'Asia',
    data: [502, 635, 809, 947, 1402, 3634, 5268]
  }, {
    name: 'Africa',
    data: [106, 107, 111, 133, 221, 767, 1766]
  }, {
    name: 'Europe',
    data: [163, 203, 276, 408, 547, 729, 628]
  }, {
    name: 'America',
    data: [18, 31, 54, 156, 339, 818, 1201]
  }, {
    name: 'Oceania',
    data: [2, 2, 2, 6, 13, 30, 46]
  }]
}
The hope is that Geckoboard will get enough positive feedback from this new Highcharts integration that they will continue to expand the types of charts supported, and - more importantly - offer a Highchart widget builder for its various integrations so that we can make the most out of data from sources like Google Analytics.